
By Joe Halwax, CAIA, CIMA
Managing Director, Institutional Investment Services

and Frank Holsteen
Managing Director, Investment Management
October 3, 2023
| Index | Q3 2023 | 2023 YTD |
| S&P 500 – Gross Return | -3.27% | 13.07% |
| MSCI EAFE – Net Return | -4.11% | 7.08% |
| Bloomberg U.S. Aggregate | -3.23% | -1.21% |
| Bloomberg Global Aggregate | -3.59% | -2.21% |
| Bloomberg Commodity Index – Total Return | 4.71% | -3.44% |
| MSCI EM (Emerging Markets) IMI – Net Return | -2.12% | 3.38% |
| Russell 1000 Growth – Total Return | -3.13% | 24.98% |
| Russell 1000 Value – Total Return | -3.16% | 1.79% |
| U.S. 10-Year Yield | 0.76% | 0.69% |
| U.S. Dollar Index | 3.17% | 2.56% |
Given our Midwest roots, we can’t help but liken this year’s economic resiliency to that of “Rudy” from Notre Dame. Just as the college football world underestimated Daniel Eugene “Rudy” Ruettiger 50 years ago, market pundits keep underestimating the U.S. economy in 2023. While most expected economic growth and inflation to cool significantly by year-end—possibly even moving toward Federal Reserve (Fed) rate cuts and a recession—those predictions now seem premature.
But as seen in the table above, the third quarter was mostly negative for financial markets. We may blame this partially on the fact that sustaining the robust gains of the year’s first six months was always going to be a tough task. The Rudy-like resiliency of economic data drove interest rates higher, postponing the eagerly awaited “Peak Fed” moment where the central bank pauses its rate hikes. Investors continue to wonder whether the Fed will indeed deliver a “soft landing,” or a slowing of the economy/inflation without creating a recession, a spike in unemployment or a decline in asset prices.
That question is growing more intense as some economic cracks are starting to appear. New home sales are softening, with August’s total down 8.7% from July. The Conference Board’s consumer confidence gauge fell to 103 in September, down from 108.7 in August. Since July 31, the widely watched 10-year U.S. Treasury yield has risen from 3.96% to 4.57%, a very sharp move that increases the costs of borrowing on items like mortgages and cars. In that same period, the S&P 500 index of U.S. stocks has fallen 6.5%. It’s likely that sharply higher interest rates are finally starting to drive some anxiety for investors and consumers.
Below we outline even more headwinds—and tailwinds!—for the economy and markets.
| Tailwinds | Headwinds |
| Loose fiscal policy in the U.S | Declining consumer confidence and manufacturing data |
| Higher-than-expected corporate earnings (profits) | Oil prices nearing $100 per barrel |
| Increases in productivity due to AI | Sluggish growth in China |
| Resilient U.S. economic growth | High U.S. equity valuations |
| Inflation has peaked | High interest rates in U.S. and developed world |
| Robust job market | Continued Ukraine / Russia war |
We’ll now dive further into several of these storylines below.
At its September meeting, the Fed kept its policy rate at a range of 5.25% – 5.50%. Central bank officials signaled one more rate hike is likely in 2023 before an extended pause.
Investors coined such a move “higher for longer.” This expression suggests that interest rates are expected to stay at a peak exceeding 5% for several quarters before any cuts occur. This outlook is underpinned by the increasing consensus that inflation will remain above the Fed’s 2% target well into 2024.
Many of our participants and clients have asked about the remarkable resilience of the U.S. economy, inflation and stock market in the face of higher rates, and whether this will continue in a higher-for-longer scenario.
One key driver here is fiscal policy. Remember, central banks control monetary policy. Elected officials oversee fiscal policy. What’s interesting is the current contradiction between these policies. The U.S. government has expanded its spending and grown its debt quite significantly—usually an economically stimulative move—while the Fed has been fighting hard to cool the economy.
Chart 1: U.S. Federal Net Debt (Accumulated Deficits) as a % of GDP, 1940 – 2023
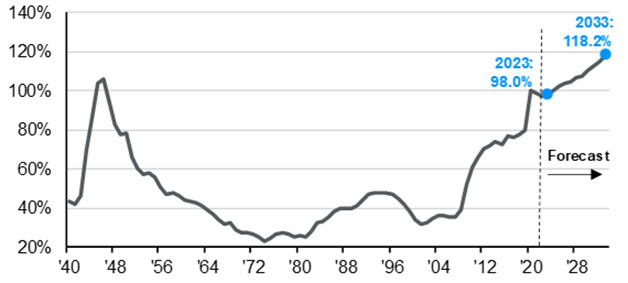
(Source: J.P. Morgan Asset Management, Congressional Budget Office)
As we can see, this level of debt relative to the overall economy hasn't been witnessed since World War II. This juxtaposition will be important to monitor, as it will likely impact economic growth and inflation going forward.
After peaking in June 2022 at 9.1%, year-over-year Consumer Price Index (CPI) inflation bottomed in June 2023 at 3.0% before ticking higher to 3.7% in August. Housing and energy prices remain heightened, keeping the CPI at stubbornly high levels. Meanwhile, U.S. unemployment came in at 3.8% for August, which was up from 3.5% in July but still very strong by historical measures. Average hourly earnings were up 4.3% year over year, slightly ahead of inflation—another indicator of a strong labor market.
So, can we find a strong “canary in the coalmine” signaling that economic activity is set to cool sharply? Perhaps it’s in the manufacturing data.
The Institute for Supply Management’s (ISM) Purchasing Managers Index (PMI) is a closely tracked gauge of industry activity. It’s based on a survey of manufacturing firms across the country and measures sentiment as it pertains to several business indicators. A reading below 50 indicates that companies are reporting contraction rather than expansion. The ISM PMI came in at 47.6 in August, marking its tenth-consecutive month below 50—the longest such stretch since 2007 – 2009. Such a long downtrend in manufacturing could certainly be an indicator of broader economic softening to come.
The S&P 500 was down 3.3% in Q3, consolidating after a strong start to 2023, bringing its year-to-date gains to 13%. The Russell 1000 Growth and Value indexes both declined about 3.1% for the quarter, though growth is still higher than value by more than 23 percentage points for the year. Meanwhile, the Russell 2000 index of small-cap stocks was down 6% on the quarter, widening its year-to-date gap against the S&P 500 to 11%.
By some measures, the U.S. stock market is more concentrated in the largest companies than ever before, led by the strong performance of giant technology company stocks this year. For example, the 10-largest stocks in the S&P 500 accounted for about 32% of the index at quarter-end.
Chart 2: Weight of the Top 10 Stocks in the S&P 500 as a % of S&P 500 Total Market Capitalization (as of September 31, 2023)
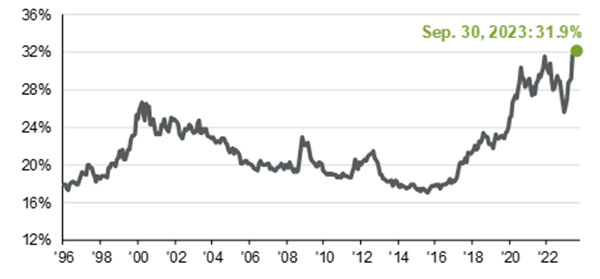
(Source: J.P. Morgan Asset Management)
Many investors have started to wonder about the potential risks associated with this remarkable market concentration. One important factor to consider is valuations.
As we noted last quarter, many of the companies leading the market this year are aligned with AI and technology themes. These tech companies have demonstrated solid earnings growth, but that hasn’t kept pace with their returns. As such, the earnings multiples reflected in their stock prices have expanded significantly. The forward Price-to-Earnings (P/E) ratio of the 10-largest stocks now sits at 25.9x, which is more than 45% higher than the multiple of 17.8x for the overall market.
Chart 3: P/E Ratio of the Top 10 and Remaining Stocks in the S&P 500, Next 12 Months (1996 – Present)
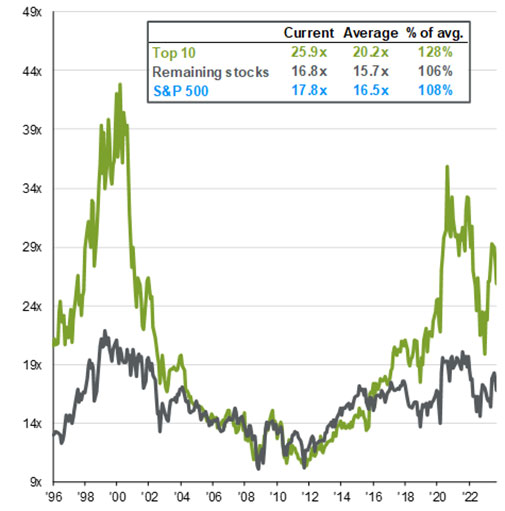
(Source: J.P. Morgan Asset Management)
This trend probably explains why actively managed U.S. equity strategies have generally underperformed broad market indices over the past year—many active managers are loath to overpay for expensive-looking stocks while also concentrating portfolio risk in essentially a single industry. These high valuations also suggest the market will need strong earnings in Q4 to support such levels.
Global economies and their stock markets are also showing mixed trends in Q3. International stocks, measured by the MSCI EAFE Index, were lower on the quarter by 4.1%, lowering their year-to-date gains to 7%.
China remains a disappointment amid paltry economic growth and continued uncertainty in the real estate market. Approximately 70% of household wealth in the country is tied to the now-uncertain value of homes. Chinese stocks (MSCI China A shares) were down 4.6% on the quarter and 8.8% for the year (in U.S. dollars).
Japanese stocks were down a more modest 1.6% on the quarter and remain about 11% higher on the year, putting them near a 33-year high. This can be attributed to the more accommodative monetary policy adopted by the Bank of Japan in recent years. Fewer rate hikes and balance sheet reductions have resulted in a boon for the Japanese economy and markets.
Meanwhile, Europe continues to experience anemic growth, with GDP for 2023 near just +1% year over year and forecasts calling for a modest +1.7% next year. Eurozone inflation has remained persistently high, and the region lacks the extensive fiscal support measures seen in the U.S. that we mentioned earlier. Accordingly, European stocks have struggled.
Nevertheless, as we wrote last quarter, the valuations of European stocks look attractive compared to their U.S. counterparts. European inflation is also anticipated to cool soon, with expectations calling for a dip to 3% in 2024. This all begins to beg the question—once the spigot of fiscal support is closed in the U.S., could we be prime for some international outperformance?
The U.S. bond market experienced a 3.2% decline in Q3 as yield rose. Remember—when yields rise, bond prices fall. This quarter saw the 10-year yield climb 60 basis points, breaking 4.5% for the first time since November 2007 (that’s before both COVID and the Great Financial Crisis! ).
On the year, the Bloomberg U.S. Aggregate Index is down 1.2%. Unless there is a significant fourth-quarter rally, the major bond indexes are on track for their third-consecutive year of decline, a trend unprecedented in the history of the United States since its founding in 1776.
The U.S. yield curve became less inverted following the Fed’s September meeting, with the 2-Year Treasury yield about 40 basis points higher than the 10-Year. Note the blue line showing rates as of September 30 compared to the green line showing rates as of December 31:
Chart 4: U.S. Treasury Yield Curve (as of September, 2023)
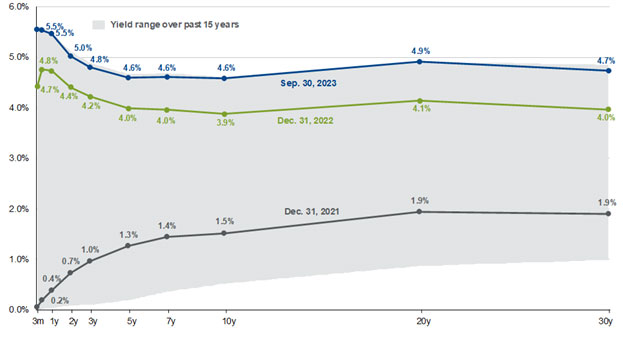
(Source: J.P. Morgan Asset Management)
Overall, we see the third quarter highlighting the intrinsic dynamism of financial markets. It’s evident that inflation and advancements in AI have exerted significant influence on financial markets—but where there are risks there are opportunities, and vice versa. Looking forward, the remainder of 2023 will be closely monitored for actions taken by the Fed, elected officials, and central banks and policymakers around the world.
Regardless of your investment profile, the unpredictability of these developments underscores the enduring importance of discipline, patience and commitment to your long-term investment strategy. As we chart our course into the future, remaining well-informed and adaptable remains paramount.
We have updated our website with a new look and made it simple to navigate on any device.
We will continue to add more valuable information and features. Please let us know how we are doing.
P.S. For plan sponsors and plan participants, we have a new look for you too. Check out the Wespath Benefits and Investments website.