
By Joe Halwax, CAIA, CIMA
Managing Director, Institutional Investment Services

and Neil Sobczak
Manager, Institutional Investment Services
July 5, 2023
| Index | Q2 2023 | 2023 YTD |
| S&P 500 – Gross Return | 8.74% | 16.89% |
| MSCI EAFE – Net Return | 2.95% | 11.67% |
| Bloomberg U.S. Aggregate | -0.84% | 2.09% |
| Bloomberg Global Aggregate | -1.53% | 1.43% |
| Bloomberg Commodity Index – Total Return | -2.56% | -7.79% |
| MSCI EM (Emerging Markets) IMI – Net Return | 1.62% | 5.62% |
| Russell 1000 Growth – Total Return | 12.81% | 29.02% |
| Russell 1000 Value – Total Return | 4.07% | 5.12% |
| U.S. 10-Year Yield | 0.32% | -0.07% |
| U.S. Dollar Index | 0.39% | -0.59% |
The second quarter closed with mixed results for global financial markets, as regional bank concerns faded, headline inflation fell to 4% and the near-term outlook for the U.S. Federal Reserve’s (Fed) monetary tightening remained uncertain. U.S. equities rallied 8.7% on the quarter, while the bond market declined 0.8% and global commodities fell 2.5%.
The U.S. debt ceiling was also a near-daily concern for investors throughout much of Q2. The situation was finally resolved in June—just days before the government may have run out of funds—with a two-year deal that required both sides to compromise. This deal avoided what may have been significant market volatility.
All in all, Q2’s activity has left us with fairly positive financial markets through the first six months of the year.
And if the first half of 2023 reminded us of anything, it is that forecasting both macroeconomics and financial markets is very difficult. Markets have remained resilient despite the debt ceiling debate, an inverted yield curve, regional bank failures, continued war in Ukraine and the possibility of “higher-for-longer” interest rates from the Fed. If you had a crystal ball on January 1 and saw this list of headwinds, you would likely not have expected strong stock market performance through the first half of the year.
U.S. stocks fueled by technology companies, growth of AI
The headline gains of 17% in the S&P 500 during the first half of 2023 were strong, but a deeper dive shows that this is a very bifurcated market. Much of the U.S. equity market’s recent strength has been supported by just a few technology companies and investors’ “FOMO” (fear of missing out!) surrounding stocks that could benefit from the widespread adoption of Artificial Intelligence (AI).
One such example is Nvidia, a manufacturer of computer chips. Nvidia is a leader in the AI market, and its recent performance—up 52% in Q2 and 189% through mid-year—reflects the excitement around the growing technology. That market excitement is translating into growth in the company’s business, too. In late May, Nvidia shocked investors by announcing that it expects Q2 revenue to reach $11 billion, sharply higher than the $7.2 billion expected by analysts and driven by the growth of AI.
This huge positive guidance triggered a wave of AI optimism that could prove to have staying power. Just look at the pace of consumer adoption of the technology—illustrated here by the rapid growth of ChatGPT compared to other tech names, from Netflix to Spotify and Instagram:
Chart 1: Time to One Million Users
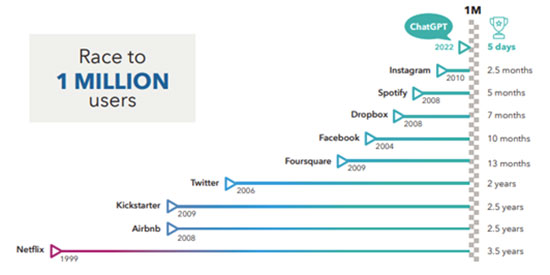
(Source: Capital Group and Statista: https://www.capitalgroup.com/individual-investors/cy/en/insights/articles/3-views-future-growth-investing.html)
Many of the other names that could benefit from AI are the technology companies you are likely familiar with (some of which are depicted above). These are the very same mega-cap tech companies that have also been buoying the U.S. equity market so far this year.
A few clever market pundits have picked up on this trend, dubbing the tech leaders the “Super 7” compared to the S&P 493. These stocks are Nvidia, Facebook parent Meta, Tesla, Apple, Amazon, Google parent Alphabet and Microsoft.
Chart 2: "Super 7" Stocks vs. the S&P 493
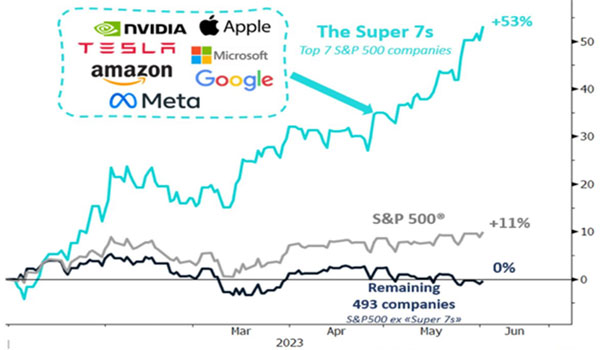
(Source: Bloomberg. Data as of June 7, 2023)
If you are wondering how such stark divergence is possible, we would remind you of the old investment adage, “The market can remain irrational longer than you can remain solvent.” This trend is remarkable, but as mentioned earlier, these things are difficult to forecast!
And it’s not just AI, as we see a similar trend when zooming out a bit. The Russell 1000 Growth Index has risen 29% in 2023, significantly outpacing the Russell 1000 Value at 5%. This is notable because growth stocks historically benefit from a lower-rate environment. Low interest rates make it easier for growing companies to borrow money, and they also mean lower discount rates, which makes the present value of their future cash flows/earnings higher.
With inflation remaining sticky and markets adjusting to the possibility of higher-for-longer interest rates, many expected the large growth names would lag. So, besides the “Super 7” and AI, why are we seeing such a strong move in large-cap growth amid this unfavorable interest rate backdrop?
One possible explanation is that large-cap companies, particularly mega-cap tech leaders, are increasingly being seen as “safety plays” by investors. While they are still growing rapidly, these companies have huge competitive moats, predictable and durable revenues, and high margins. There has also been a reluctance to enforce strict antitrust laws in the U.S., and it is extremely rare to see any technology mergers blocked, resulting in only a few options for many of the critical daily-use items or services these companies provide. Finally, many of the large-cap names have very publicly announced layoffs and a shift in focus from growth to profitability. This has been well received by investors, as tech companies have often been accused of bloated payrolls and opulent perks.
International equities positive, but slightly lagging the U.S.
International equities were slightly behind U.S. stocks, with the MSCI EAFE index up 3% in Q2 and the MSCI Emerging Markets Index up 1.6%. Specific international indexes are very mixed, with positive stories like Japan (stock market at 33-year high) benefitting from loose monetary policy and Mexico (up 25% year to date) buoyed by the potential for expanded trade with the U.S. amid the theme of companies “reshoring” manufacturing to the country. Compare that to China, down 7% in Q2 and 6% year to date as its economy remains soft despite reopening.
In fact, investors interested in valuation metrics are likely to see plenty of compelling data abroad. Broadly, international equities currently maintain much cheaper valuations when looking at PE—the MSCI EAFE Index is at 14x earnings, while the MSCI EM Index is at 10x. Both look attractive compared to the S&P 500 at 17x. We’re reminded of our Chief Investment Officer Dave Zellner’s recent words of wisdom about investing internationally here: Why Does Wespath Invest in International Companies?
Bonds and commodities sluggish in Q2
The U.S. bond market was lower by about 1% on the quarter. Despite inflation cooling somewhat in the U.S., higher prices are proving sticky around the world and central banks are still tightening. That pushed yields higher and caused the dip in bond prices. Still, after double-digit declines in 2022, U.S. bonds are up 2% through the first half of 2023.
On the other hand, commodities have fallen this year. The Bloomberg Commodities Index was down 3% on the quarter, driven by a decline in oil (-3.5%), and has continued to decline since peaking with a +26% return in Q1 2022. Our colleague Andrew Steedman recently wrote about what caused the commodities spike last year and why the asset class is down in 2023: Investing in Commodities: Why We Do It, and Why the Market Has Dipped in 2023.
One key thing that Andrew points out is the possibility of a recession soon. We’ll talk more about that in a moment, but it is worth noting that corporate bonds currently look well positioned to deal with an economic slowdown if it does come. Investment-grade corporate bonds are displaying strong balance sheets and cash positions, and about half of the high-yield market has a claim to the highest-possible credit rating in the category, which is an improvement on past conditions. Furthermore, while yield curve volatility remains high (another thing we’ll discuss in a minute), yields are sitting near the top end of their ten-year averages.
All eyes on inflation and the Fed… again
Ultimately, the near-term outlook for all the asset classes we’ve mentioned will continue to depend on the market’s reactions to a few recurring themes: inflation and the Fed.
U.S. inflation, as measured by the Consumer Price Index (CPI), eased to 4.0% year over year in May, its lowest level in two years and well below the June 2022 peak of 9.1%. However, U.S. employment remains strong, surprising economists who expected that tighter monetary conditions would lead to weaker labor market. Nonfarm payrolls for May were 339,000 (ahead of the 190K expected by economists), with unemployment at 3.7% (near 50-year lows) and wages rising by 4.3% year over year. This persistent strength in employment seems to imply we’re not yet in a recession, but it may keep inflation higher than we’d like for a while longer.
Ideally, the Fed is trying to create a “soft landing,” or a slowing of the economy (and inflation) without creating a recession, turmoil in the job market or a sharp decline in financial markets. This is a tough task, and many investors have eagerly anticipated an end to the Fed’s rate hiking for fear that the central bank would overshoot and spoil the soft landing. Market expectations now imply one or two more 25 basis-point hikes in 2023 before the peak of this cycle.
The U.S. yield curve became even more inverted following the Fed’s June meeting, with the 2-Year more than 100 bps higher than the 10-Year. Note the blue line showing rates as of June 30 compared to the green line showing rates as of January 1:
Chart 3: U.S. Treasury Yield Curve (as of June 29, 2023)
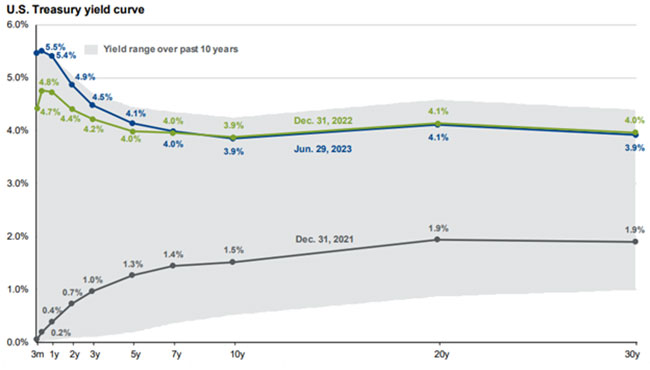
(Source: J.P. Morgan Asset Management)
The curve has inverted further as the front end has been pushed higher, anticipating further rate hikes. It’s also important to note that the market has consistently underpriced rate hikes in this cycle. It’s very possible that interest rates will end up being higher for longer than many investors anticipated.
Still, investors have had time to consider and price in this reality. As we’ve noted, markets have thus far proven resilient to this and other headwinds and uncertainties. We therefore end this quarter’s recap on a similar note to our previous summaries—though you never know where markets may move next, it’s important to have discipline, patience and commitment to your long-term plan. Please contact our team with any questions you may have.
We have updated our website with a new look and made it simple to navigate on any device.
We will continue to add more valuable information and features. Please let us know how we are doing.
P.S. For plan sponsors and plan participants, we have a new look for you too. Check out the Wespath Benefits and Investments website.