
By Joe Halwax, CAIA, CIMA
Managing Director, Institutional Investment Services
and

Rashed Khan
Director, Portfolio Risk and Analytics
January 2, 2024
Did you know that America’s—and now many NFL football fans’—darling Taylor Swift sings over 44 songs at her concerts, with shows lasting for nearly four hours? That’s a lot of Taylor. And while she is said to be an amazing artist, there must be some parents or significant others in the audience looking at their watches and wondering, “When does this end?”
Many market pundits and economists have been asking the same question about the U.S. economic expansion for two years now. Yet the economy keeps defying expectations. With the latest GDP data showing a growth rate of 4.9% in the third quarter, it’s starting to feel like the continued calls for a recession are a Taylor show during the third encore.
 (Source: Shutterstock)
With that said, the market is pricing in a slower growth in 2024, with the first rate cuts since the hiking cycle began in March 2022 expected early next year. While predicting economic data has been quite difficult lately, it does appear the long-awaited slowdown is inching closer to reality.
If markets climb a wall of worry, in Q4 they used a trampoline. From the end of July to the end of October, the U.S. stock market suffered a 10% correction despite near-record corporate earnings. But following improving inflation data for October—3.2% vs. 3.3% expected in the Consumer Price Index (CPI)—and dovish comments from the Federal Reserve (Fed), markets went on an uber-bull run during November.
This was an “everything rally,” delivering both the strongest November in the S&P 500 since 1980 and the strongest November for the Bloomberg Aggregate Bond Index since 1985.
In December, the Grinch stayed away, with continued dovishness from the Fed supporting asset markets for a strong finish to the quarter and the year. All in all, Q4 showed investors that inflation and Fed policy are still the main drivers of yields and asset prices.
| Index | Q4 2023 | 2023 YTD |
| S&P 500 | 11.7% | 26.3% |
| MSCI EAFE | 10.4% | 18.2% |
| Bloomberg U.S. Aggregate | 6.8% | 5.5% |
| Bloomberg Global Aggregate | 8.1% | 5.7% |
| Russell 1000 Growth | 14.2% | 42.7% |
| Russell 1000 Value | 9.5% | 11.5% |
Economic data continues to soften
U.S. CPI inflation peaked at 9.1% in mid-2022 and fell to 3.1% by November 2023, with core inflation—which excludes the more volatile categories of food and energy—slightly higher at 4%. As noted, U.S. GDP growth remains strong but is expected to slow to just 1.4% in 2024 according to the Fed’s forecast.
European inflation is falling even faster, down from 10.6% in 2022 to 2.4% in December, though core inflation is also slightly higher, like it is in the U.S. Meanwhile, economic growth in Europe remains weak. GDP data showed a -0.1% move in Q3, and estimates for the full year reflect growth of just 0.6%. That growth rate is expected to rise slightly to 0.8% in 2024 according to European Central Bank projections.
While elevated core inflation rates in the U.S. and Europe do raise questions about the potential persistence of higher prices, the general trend of softening economic data in both regions tends to support the idea of rate cuts in 2024 and a continuation of the late-2023 rally.
Equities push higher, but China disappoints
The S&P 500 gained 11.7% in Q4, with small cap stocks up 14% after a huge gain for the Russell 2000 Index of 12.2% in December alone. Small caps, which had lagged for the first nine months, are expected to benefit in 2024 from an easier Fed. Looking at the Russell 1000 Growth and Value indices, growth outperformed by about 4% in Q4 and by a whopping 31% for the year.
Looking abroad, the MSCI ACWI ex-U.S. IMI returned 9.8%, with the MSCI Emerging Markets Index up 8.0%. The emerging market index was weighed down by a heavy tilt to Chinese companies (25% weighting), which declined 4.2% on the quarter to end the year 11.2% lower (in U.S. dollars).
As we’ve covered before, economic conditions in China have disappointed investors as the country looked to rebound from extended COVID lockdowns and volatility in its real estate market. Our colleague Myles recently recapped these headlines and what they mean for the Wespath funds: Tech Wars, Real Estate Troubles and More: Understanding Developments in the Chinese Economy.
Bonds avoid historic slump
Heading into Q4, the Bloomberg U.S Aggregate Index was on track to post its third-consecutive negative year, which would have been the first time that’s ever happened. But with help from the November “everything rally,” the index posted a positive return of 6.8% for the fourth quarter to end the year 5.5% higher. This positive number was driven by lower yields, as the U.S. 10-year and 2-year fell by 69 and 79 basis points in Q4, respectively.
If you’re interested in hearing more about these moves, several of our colleagues shared their perspectives during the quarter on various bond market trends and opportunities across the fixed income ecosystem: An Exciting Time to Be a Lender?
2023 will be remembered as a year with several narrative shifts. We started the year with most pundits calling for a recession, but by summer the consensus view shifted to “higher for longer”—meaning higher inflation and higher interest rates for longer than initially expected. But as mentioned, by Q4 the narrative shifted again to cooling inflation, calls for a “soft landing” for the economy and growing anticipation for rate cuts in 2024.
These dramatic turns in the market’s prevailing economic expectations underscore how difficult forecasting has been in recent years. We might consider this a prolonged distortion caused by COVID and our adaption to the “new normal.” Obviously, what we all consume, how we consume it, where we get it from and how/where we work have all changed since the onset of the pandemic. It makes sense that economic forecasting and modeling may take some time to normalize as well.
2023 produced strong returns, Wall Street analysts were wrong
Amid all the headline economic unpredictability, forecasting what would happen in the global financial markets also proved difficult. For example, 2023 was the first year since 2000 where Wall Street strategists collectively predicted a down year for the S&P 500. The S&P 500 finished the year up 26.3%.
The stock market’s surprisingly positive performance is another lesson on the challenges of market timing, the importance of a long-term view and the value in staying invested through uncertain periods. It’s also a lesson in context and emotion. Volatility in the U.S. equity market, as measured by the popular VIX Index, moved lower in 2023, declining from a peak of 25 in March to just 12 in December (comparable to where it was in 2019, before the pandemic).
So, even if 2023 sometimes felt volatile, it was really a calmer year in the U.S. stock market. The S&P 500 now sits just below its all-time high as we head into 2024:
Chart 1: S&P 500 History (2021 – 2023)
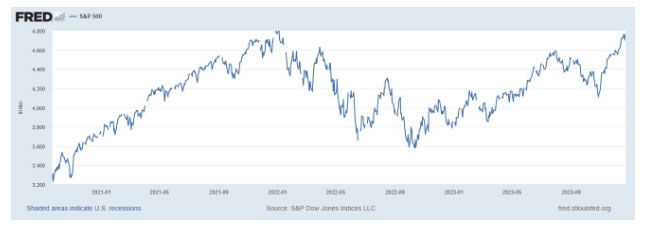 (Source: https://fred.stlouisfed.org/)
Widening dispersion in market cap and style
Another major storyline, which we touched on throughout the year, was the gap between mega-cap stocks and their small to mid-cap counterparts. A look at the 2023 returns of the 50-largest names in Russell 3000 Index (the Russell Top 50 Index) compared to the smallest 2500 names (the Russell 2500 Index) demonstrates this dispersion well: the Russell Top 50 Index returned 37.8%, while the Russell 2500 returned just 17.4%.
We have also seen a similar dispersion in the equity style categories. We mentioned earlier that the gap between the Russell 1000 Growth and Value indexes narrowed slightly to close the year, but was still a prominent theme throughout 2023. The broader Russell 3000 Growth and Value indexes show a similar gulf, with value returning 11.7% and growth tallying a 41.2% gain.
These numbers do not follow historical trends. In fact, in the 20-year period leading up to 2023, we saw very different outcomes:
Chart 2: Annualized Performance (20-Year Period Ending Dec. 31, 2022)
| Index | Returns |
| Russell Top 50 Index | 9.1% |
| Russell 2500 Index | 10.3% |
| Russell 3000 Growth Index | 10.7% |
| Russell 3000 Value Index | 8.8% |
A longer-term history for growth and value stocks brings their performance even closer to each other: the 30-year annualized return for the Russell 3000 Growth Index is 9.2% compared to 9.5% for the Russell 3000 Value Index. It’s clear that 2023 is hardly the norm.
The “Magnificent Seven” dominate
Alongside the size and style dispersion trend has been the continued concentration of the U.S. equity market. As we covered throughout the year, most of the performance gains were delivered by a handful of names, dubbed the “Magnificent Seven.” The seven names are Apple, Amazon, Alphabet (Google’s parent), Meta Platforms (Facebook’s parent company), Microsoft, Nvidia and Tesla.
Together, these seven names make up close to 28% of the entire S&P 500 and delivered nearly two-thirds of the index’s total return during the year. Investors who did not dedicate 30% of their portfolio to just these seven names struggled to keep up with the S&P 500 during 2023. In other words, this was not a good year for diversification.
Taking lessons from history, remembering the tech bubble
Despite its deviations from long-term historic norms, if we look back in time, we notice that 2023 was not entirely unique. We have witnessed similar concentrated markets in the past. Some may even consider 2023 reminiscent of the “tech bubble” era of 1999 and 2000, when the 10-largest names in S&P 500 made up a similar 28% of the index.
History shows market concentrations have their own peaks and troughs, and while a select few names may drive near-term performance, a more diversified portfolio tends to do better over a long period of time. One simple way to check this is to compare a market-cap weighted S&P 500 Index against an equal-weighted S&P 500:
Chart 3: Market-Cap Weighted S&P 500 vs. Equal-Weighted S&P 500
| Index | 2023 Performance | 20-Year Period Ending Dec. 31, 2023 |
30-Year-Period Ending December 31, 2023 |
| S&P 500 Index (Market-Cap Weighted) | 26.3% | 9.7% | 10.2% |
| S&P 500 Index (Equal-Cap Weighted) | 13.9% | 10.1% | 10.9% |
Despite what we’ve seen recently, the fundamental principles of investing remain resilient. A diversified and disciplined portfolio, constructed with sound fundamental processes, tends to outperform in the long run. 2023 was an anomaly with some historical precedent, not an indicator on how markets usually work.
As we look further ahead into the New Year, the top themes to watch will be many of the things we’ve touched on above, as well as few headlines you’re likely already monitoring:
We’ve probably made our point clear that we see little value in excessive forecasting. Regular readers know it isn’t our style to try to time markets, and the unexpected developments of 2023 only reinforced that case. Simply put, forecasts are too often wrong (remember “Inflation is transitory” in Q1 2021?!).
With that said, we can look at historical norms and averages to get a sense of what markets might do under comparable circumstances. For instance, we may want to consider what has happened in the past when we’ve neared the end of a rate hiking cycle.
One typical behavior following numerous rate hikes is the tendency to favor cash-like short-term assets like those found in money market funds. With interest rates over 5% today, that’s exactly what is happening. There’s about $5.7 trillion in money markets now, up from $3.5 trillion in 2020. This is totally understandable—after money markets paid next to nothing for over a decade after 2009, current rates of 4% to 5% in relatively low-risk assets are obviously appealing. 5% in what feels like “free returns” in a time when the Fed is intentionally trying to slow the economy seems to make sense.
However, historical averages tend to show that the end of rate-hiking cycles is when investors ought to be looking for opportunities in stocks and bonds. Here’s a look at these asset classes over the last four hiking cycles, using the 3-month U.S. T-bill as a proxy for cash equivalents:
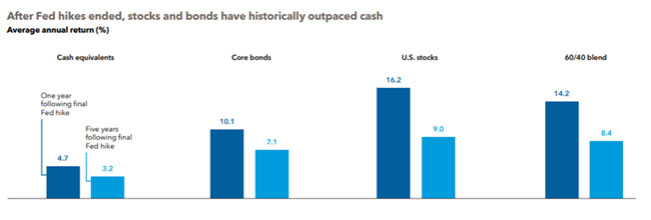 (Source: Capital Group)
As we can see, historically, the end of the hiking cycle has proven to be a good time for investors to pull cash from the sidelines and invest in stocks and bonds. Long-term, patient investors should consider this history and be thoughtful about not missing on opportunities in 2024. You’ve likely heard our team at Wespath talk about staying invested through market cycles and sticking to our disciplined approach. We certainly continue to have conviction in that philosophy right now.
We have updated our website with a new look and made it simple to navigate on any device.
We will continue to add more valuable information and features. Please let us know how we are doing.
P.S. For plan sponsors and plan participants, we have a new look for you too. Check out the Wespath Benefits and Investments website.