
By Joe Halwax, CAIA, CIMA
Managing Director, Institutional Investment Services
January 4, 2023
The fourth quarter was largely positive for global financial markets as inflation data came in lower than expected and expectations that central banks would become less aggressive with monetary policy tightening rose.
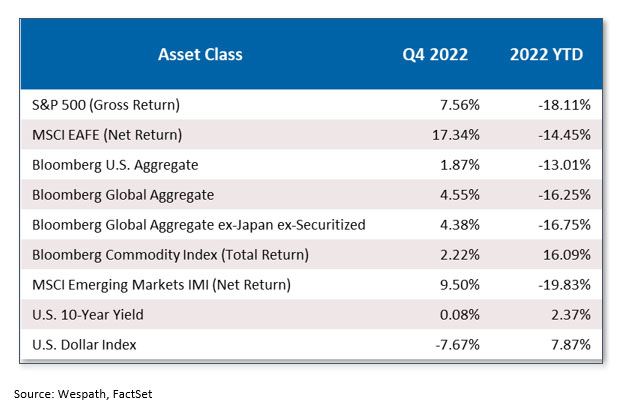
Global equities were up, led by emerging markets (EM) at +9.5% and international more broadly at +17.3%. These gains were driven, in part, by a 7% decline in the U.S. dollar, which had been on a torrid run in 2022 thanks to early and aggressive rate hikes from the Federal Reserve (Fed). The dollar index was still up 10% on the year, but its decline in Q4 helped the outperformance of non-U.S. stocks.
In the U.S., the S&P 500 closed the fourth quarter at +7.6% to finish the year at -18%. Meanwhile, fixed income markets were strong during the quarter as investors’ concerns shifted from inflation to the potential for a recession, pushing the yield curve lower. At one point in 2022, the Bloomberg Aggregate Index was down 16%, but the broad-based bond index gained 2% in the fourth quarter to close at -13% for the year. Double digit losses in the bond market are extremely rare. This performance underscores the difficulty that asset managers had forecasting inflation and other economic conditions throughout 2022.
The fourth quarter started with optimism of a Fed “pivot,” or a shift by the central bank away from rate hikes and toward a recognition that a “terminal rate” (or peak) was closer. This reflects what we saw for most of 2022—the markets closely following every inflation report and Fed meeting, with volatile moves in asset prices occurring as expectations were adjusted.
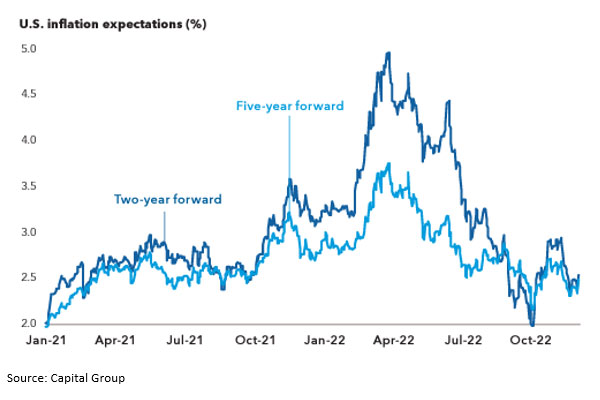
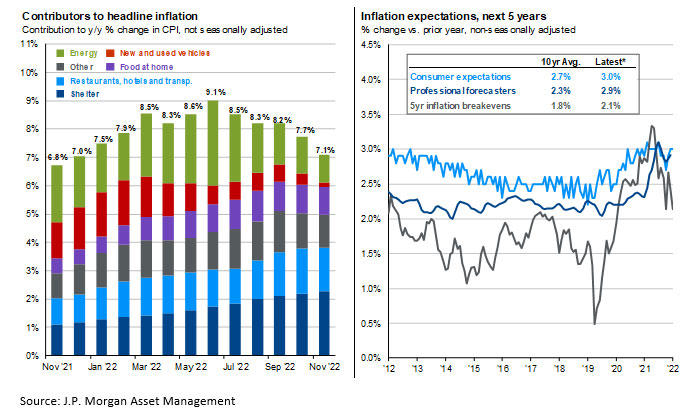
Chart 1: Inflation expectations have fallen
In October, the S&P 500 rallied 8.1% amid hopes that inflation had peaked, and that the Fed would slow the pace of rate hikes.
In November, we saw equity markets rally further as the theme of sharp reactions to economic data and Fed commentary continued. This was highlighted by the latest inflation report, which indicated that the year-over-year rise in the Consumer Price Index (CPI) had eased to just 7.7%. This was below the 8% expected and the lowest CPI reading since January 2022. Later in November, Fed Charmain Jerome Powell offered some dovish commentary, suggesting the pace of rate hikes would slow.
In addition to shifts in inflation and possible Fed policy, the November rally was driven by belief that the COVID situation in China had improved and that the Chinese government would ease its “Zero COVID” policies. Investors were optimistic that fewer shutdowns in the world’s second-largest economy would lead to increased demand and improved supply chains. The MSCI China index rallied by 29% in November, while the S&P 500 added another 5.6%.
Despite what had been the worst bond market in 200 years, the combination of softer inflation and a more dovish Fed helped drive bond prices sharply higher during the quarter, particularly in the last two months of the year.
The Bloomberg Aggregate Index rallied 3.7% in November alone—the type of move in bond markets more commonly seen over the course of a year, not a month. This pushed the index’s year-to-date losses to -12.6% from a peak of nearly -16% in late October.
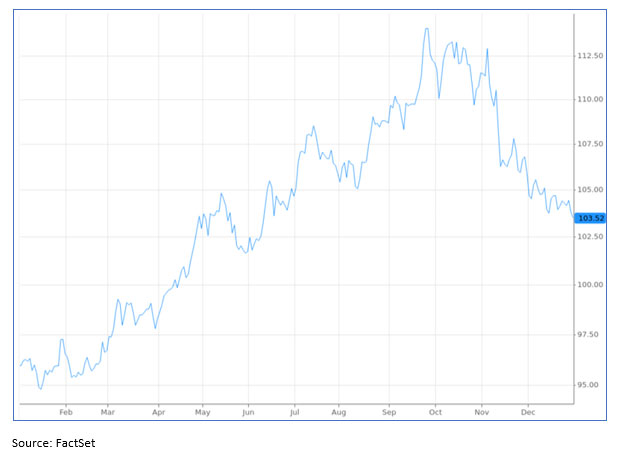
Meanwhile, the 10-year yield fell 50 basis points (bps) to 3.5% in November, and the U.S. dollar index fell 6.5%. As mentioned, the weaker dollar was very positive for international markets.
Chart 2: U.S. Dollar Index (from Dec. 31, 2021 – Dec. 31, 2022)
In December, the Fed hiked interest rates 50 bps, bringing its total rate increases for the year to an eye-popping 450 bps. Let’s recall that in December 2021 the futures markets were pricing in just two rate hikes of 25 bps each. At the end of March, there were 10 rate hikes priced in through 2024, with just 250 total bps in hikes expected. This is yet another reminder that even the best economists in the world working at global central banks did not forecast the sharp rise in inflation, nor the degree of interest rate hikes that would be required to help slow it.
The Fed’s post-hike commentary in December was more hawkish than expected, with Powell warning: “It will take substantially more evidence to have confidence that inflation is on a sustained downward path.” Similarly, the European Central bank was surprisingly hawkish, noting that significant monetary tightening remains. Not to be outdone, the Bank of Japan shocked markets by tweaking its yield curve control policy, allowing its 10-year bond to move to 0.5% from zero.
Inflation eased again in December, with U.S. CPI at 7.1% year over year, lower than the expected 7.3%. Despite the lower inflation print, the more hawkish global central bank policy was a headwind for markets in the final month of the year. The S&P 500 fell 5%, the MSCI International Index fell 6%, and the EM Index fell 2%. Bond markets were largely flat for the month.
2022 was characterized by sharply higher volatility across many asset classes, leaving investors, at times, with a feeling of having nowhere to hide. This was most evident in traditionally “safe” fixed income assets, with 2022 marking the worst year for bonds since 1788. However, higher-than-usual volatility was also seen across equities, currencies and commodities, and there were very few periods of calm markets throughout the year.
Equity and bond correlations have been largely flat or negatively correlated for much of the past 20 years, which is why a balanced “60-40” type portfolio had performed so well. In 2022, the correlation between equities and bonds quickly became positive, with both bonds and stocks suffering sharp losses as markets repriced both asset classes in face of current economic conditions.
Chart 3: Stocks and bonds rarely decline in tandem—but they did in 2022
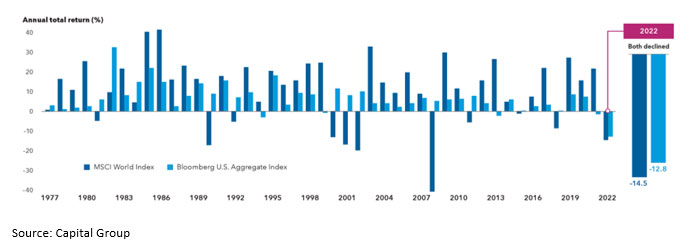
Indeed, a balanced 60-40 portfolio lost roughly 18% on the year, marking its worst year since 1937 and the third-worst year in the last century.
As we’ve discussed many times, the primary driver of this excess volatility was inflation. Until the end of 2021, global central banks, including the Fed, had characterized inflation as “transitory”—a seemingly common-sense and temporary price spike caused by the world trying to rejuvenate economies that had been shuddered by COVID lockdowns. In 2022, markets quickly shifted gears with the realization that inflation was going to remain stickier for longer and that an aggressive central bank response was needed.
Inflation reached its highest year-over-year reading for 2022 at 9.1% in June before easing to 7.1% by December. This means that inflation ran at least 7% on a 12-month basis for all of 2022, shown in the chart on the left. Inflation expectations peaked this summer near 3.5% for the next five years and have fallen in line with the drop in realized inflation, seen in the chart on the right.
Chart 4: 2022 inflation and current inflation expectations
Long-term investors like Wespath remain cognizant of so-called “mega trends” in social and economic development that are likely to have an impact on economic growth. This can certainly include the latest trends in geopolitics. As it stands at the end of 2022, the conflicts between both Russia and Ukraine and China and Taiwan are likely the two geopolitical topics with the most potential to change the world from a macroeconomic perspective. However, just like inflation, forecasting geopolitics can be a difficult challenge.
While many expected the Russia invasion of Ukraine to be over in weeks, the war has now continued for over 300 days. Ukrainian President Zelensky says there will be no surrender, though others, including French President Emmanuel Macron, are openly talking about conditions to end the fighting. While we obviously cannot forecast what will happen in this conflict, there are some observations to make regarding its impact on the global economy:
Meanwhile, we have witnessed heightened rhetoric from China regarding Taiwan. Of course, predicting Chinese geopolitics is incredibly difficult. Many have speculated that Ukraine and NATO’s success against Russia may have delayed any Chinese ambitions to assert full control over Taiwan, but forecasting China’s true intentions in the region is nearly impossible. Nevertheless, we do know that any escalation of rhetoric or additional posturing would be a major headwind for markets.
The last three years of COVID highlighted the fragility of global supply chains and our dependence on countries like China for essential goods like drugs, machinery and minerals. This was further exacerbated in February when Russia invaded Ukraine, leading to supply issues with energy and food. Wespath has argued in previous years that the world is seeing changes to globalization, and that a shift to resilient supply chains instead of low-cost or just-in-time management was occurring. Also changing with globalization is the realignment of powers: We find ourselves increasingly less in a U.S.-led unipolar world. Conditions have shifted to a multipolar world led by the U.S. (and NATO broadly) and China (with increased ties to both Russia and India). These changing power dynamics and supply chains will offer opportunities for investors.
While it is difficult to predict whether the bumpy ride investors experienced last year will continue through 2023, we do know the catalysts are likely to remain the same. Inflation and central bank policies will continue to dominate headlines. Investors will be watching closely to see if monetary tightening will push inflation to a more typical range of 2% – 3%, and perhaps even more importantly, whether these policies will result in a “hard landing” that causes an economic recession. As such, we may see that markets in early 2023 begin to shift their focus from inflation specifically to growth more generally, though the following questions are likely to capture investors’ attention throughout the year.
One of the most important questions investors will be pondering as we head into the New Year is whether or not the economy is—or will soon be—in a recession.
Q1 2022 GDP fell by 1.6% annualized, followed by Q2 GDP falling by .9%. While the National Bureau of Economic Research (NBER) uses multiple data points to define a recession, two quarters of negative GDP growth is the most broad and basic definition cited.
However, I would argue that whether or not we are in a technical economic recession is the wrong question. We have already seen that this post-COVID period is unique. Recall that we had two quarters of negative GDP growth but strong levels of employment and spending. So, we may have already had a recession in 2022, albeit a very odd one with strong levels of employment.
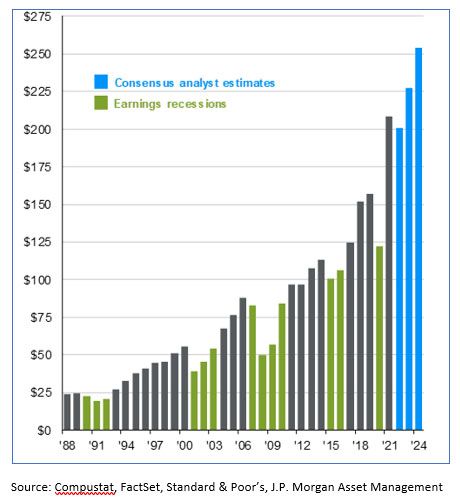
The bigger question to ask is will we have an earnings recession? Consensus estimates for S&P 500 earnings are for $231 in 2023 and $254 for 2024—a sharp increase from the pre-COVID number of $163 in 2019.
Chart 5: S&P 500 earnings per share (EPS) and EPS estimates
Nevertheless, the number of unknowns entering 2023 is relatively high, and any weakness in earnings will be a headwind for equity markets.
As noted earlier, markets are looking for clarity on inflation and monetary policy, and investors will need more time to adjust to whatever that new normal ends up being. A higher-inflation, tighter-monetary-policy scenario is very different than the low-inflation, low-interest-rate world we have seen over much of the past 20 years. The Fed is currently signaling rates near 5% and zero cuts in 2023, while futures markets are implying rates closer to 4.25% at the end of the year. This disconnect is likely to be a source of continued volatility. The actual rate path will be most influenced by inflation and employment, so investors should keep their eyes on these figures throughout 2023.
U.S. equity valuations are starting 2023 near their 25-year averages and therefore not likely to be seen as definitively cheap nor expensive. However, it is important to note that U.S. equities are starting 2023 at much cheaper levels of price-to-earnings than they started 2022 (roughly 21.0 last year vs. 16.6 currently). Meanwhile, valuations in many international equity markets are lower than both U.S. valuations and their own historical averages.
The dark grey bar in the chart below shows the 25-year range of P/E averages across the U.S., Japan, Europe, Emerging Markets and China. The purple line is the 25-year average, and the dark blue diamond is the level from the start of 2022.
Chart 6: Global valuations, current and 25-year averages (forward price-to-earnings ratio)
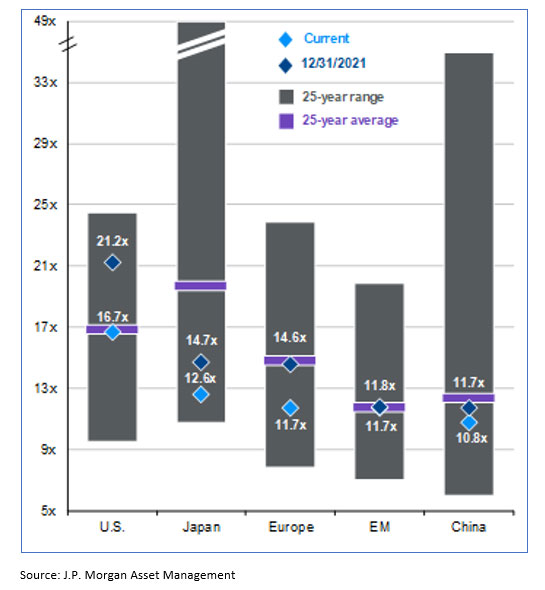
While Emerging Markets are roughly in line with their 25-year averages and last-year starting point, each of the other four markets are below early 2022 levels. Japan and Europe are also noticeably below their 25-year averages. All four international markets shown here have valuations well below those of the U.S.
Valuations are also interesting in bond markets, where investors can look to metrics like “yield-to-worst” to analyze valuation trends. Yield-to-worst (YTW) is a measure of the lowest possible yield for a bond held to maturity without default.
The chart below visualizes YTW across 12 bond sectors. The purple rectangle shows the median of the past 10 years, and the dark blue diamond is the current YTW.
Chart 7: Yield-to-worst across fixed income sectors
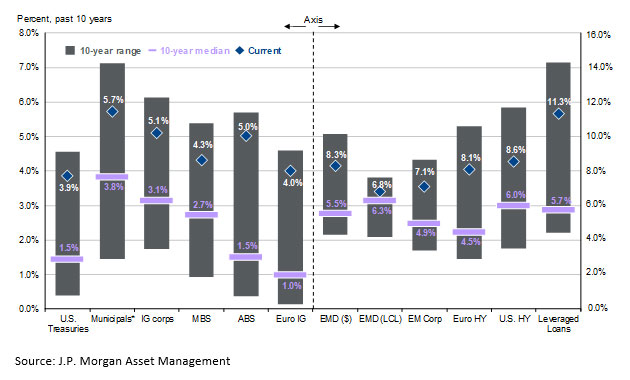
All 12 sectors are significantly higher than their ten-year medians, suggesting that bond valuations are attractive relative to levels seen in the past decade.
As mentioned above, stocks and bonds start 2023 at more attractive valuation levels than what we saw at the beginning of last year, but there are many other factors and myriad unknowns that will inevitably drive market performance in 2023.
What we know for certain is that this is an interesting time of change in the world. While much of the past two decades of market activity was driven by big technology firms, last year we saw a shift back to older industries and companies that produce physical assets. But there are also exciting new technologies such as artificial intelligence, robotics, advances in medicine and clean energy that present a changing landscape for investments. Historically, years following bear markets have been good for patient investors, and it is rare to see two negative years in a row for equities. We continue to believe investors should stay the course, remain invested and focus on long-term results.
What themes would you like us to cover in future blog posts? Let us know at [email protected]
To receive this chart each week via our Wespath Market Update e-mail, please contact our team at [email protected].
We have updated our website with a new look and made it simple to navigate on any device.
We will continue to add more valuable information and features. Please let us know how we are doing.
P.S. For plan sponsors and plan participants, we have a new look for you too. Check out the Wespath Benefits and Investments website.