
By Rashed Khan
Director, Portfolio Risk and Analytics
December 12, 2022
“Investment exclusions” are a unique aspect of mission-based investing. For Wespath Benefits and Investments, together with its subsidiaries (collectively “Wespath”), investment exclusions identify specific companies and industries that are excluded from investment holdings in response to The Book of Discipline’s call to invest in alignment with the Church’s values.1 The Church asks that Wespath “…make a conscious effort to invest… with the goals outlined in the Social Principles” (¶717).
Wespath created an Ethical Exclusions Policy informed by the Social Principles, the Book of Discipline and the Book of Resolutions. Accordingly. Wespath excludes securities from companies with core business activity that involves the production, sale and/or distribution of products/services from the following list:
Wespath also excludes certain investments related to concerns about human rights and climate change when we believe they represent excessive sustainability-related financial risk to our investments. Wespath investments are subject to our Management of Excessive Sustainability Risk (MESR) Guidelines.
We often receive questions about our investment exclusions—how do we implement them? And, more importantly, to what extent do they affect our investment funds’ performance?
Investment Exclusion Process
Wespath engages a third-party service provider—Institutional Shareholder Services—to create and maintain a list of companies excluded from investment, based on our exclusion policies. We provide this “exclusions list” monthly to our external asset managers with instructions not to invest in any of the prohibited companies. When an asset manager wants to add a new position to their portfolio, they must refer to the exclusions list to confirm the company issuing the security is not on the list. If the asset manager holds a security recently added to the list, the manager must begin the process of selling it.
Impact to Investment Performance—Passive Investments
When it comes to evaluating the extent to which exclusions affect fund performance, it is easiest to begin by examining one of our passive index funds. A passive index fund seeks to replicate the risk/return profile of a market index by holding all or most of the constituents in the index. The impact from the investment exclusions represents the main difference between the performance of the fund and the performance of the benchmark (Russell 3000 Index).
In the table below we look at a Wespath passive fund that tracks to the Russell 3000 Index, a broad U.S. stock market index. The fund, launched in January 1998, is nearing a 25-year track record. It is part of our P Series funds which primarily hold benefit plan assets.2 We are comparing gross-of-fees performance to demonstrate the impact of exclusions, as the Russell 3000 Index does not include a provision for fees.
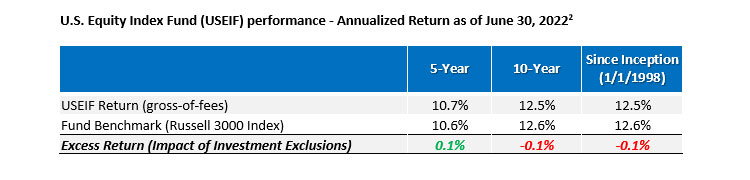
As shown in the “Excess Return” row, over the five-year, ten-year, and since-inception periods, the impact to the gross-of-fees fund performance has been negligible, plus-or-minus ten basis points (0.10%) over the long-term.
Impact on Investment Performance—Active Investments
Assessing the impact of investment exclusions as it relates to Wespath’s active portfolios is more challenging. Actively managed portfolios intentionally deviate from their benchmark index, seeking to add value in unique areas of conviction. Therefore, comparing an active portfolio against its benchmark does not reveal the performance impact of the investment exclusions.
Hence, a more meaningful approach is to compare Wespath’s investment with an asset manager to the “composite” for all portfolios using the same strategy executed by the asset manager.
In the tables below, the “Portfolio Return” represents investment performance achieved by asset managers managing various portfolios in the U.S Equity Fund (USEF).
For example, the “All-Cap Growth Strategy” Portfolio Return, is the performance of the portfolio within USEF of the asset manager that manages an All-Cap Growth Strategy. The “All-Cap Growth Strategy” Manager Composite Return is the combined performance for the All-Cap Growth Strategy portfolios of all the asset manager’s other clients. The USEF Portfolio Return reflects our investment exclusions, while the asset manager’s composite does not.
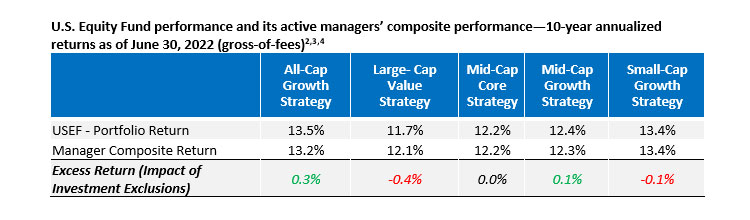
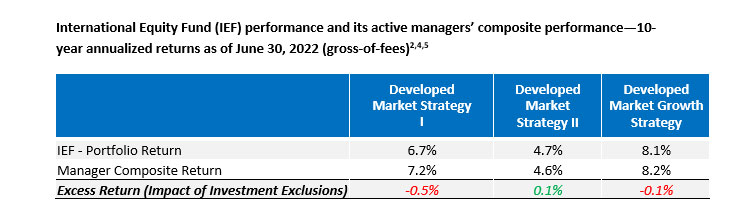
Here we also observe mainly small performance differences. Of the eight active portfolios included in the USEF and IEF, five portfolios performed in-line with their composite over a 10-year period (a difference of 0.10%, or 10 basis points or less). The remaining three portfolios showed small divergence, both positive and negative, of less than 50 basis points from their composites over the course of 10-year period.
In summary, a review of the long-term performance for both passive and active portfolios in these P Series funds indicates there has been no meaningful adverse impact resulting from the UMC’s values based investment exclusions. While there are very small positive and negative impacts, these change over time depending on the date of analysis and the performance period selected.
1 Wespath Benefits and Investments is a general agency of The United Methodist Church, a 501(c)(3) tax-exempt organization. Wespath Benefits and Investments administers benefit plans and together with its subsidiaries, UMC Benefit Board, Inc. (“UMCBB”) and Wespath Institutional Investments, LLC (“WII”) invests (or provides back-office services for) assets on behalf of benefit plan participants and beneficiaries, plan sponsors and other organizations controlled by, associated with or related to The United Methodist Church (the “Church”).
2 The performance analysis is for P Series funds managed by UMC Benefit Board, Inc., an associated entity to Wespath Institutional Investments, available to certain institutional investors prior to January 1, 2019. The I Series funds, managed by Wespath Institutional Investments, became available for investment starting in January 2019. Although both P Series and I Series asset managers use very similar strategies, the performance of a P Series fund is used in this analysis due to its longer track record.
3 All USEF managers with a 10-year performance track record have been used in this analysis.
4 Source: eVestment
5 Emerging-market active managers are not included here, as the portfolios differ from their composites for various reasons. The return comparison will not show exclusion policy impact for emerging market investments.
What themes would you like us to cover in future blog posts? Let us know at [email protected]
To receive this chart each week via our Wespath Market Update e-mail, please contact our team at [email protected].
We have updated our website with a new look and made it simple to navigate on any device.
We will continue to add more valuable information and features. Please let us know how we are doing.
P.S. For plan sponsors and plan participants, we have a new look for you too. Check out the Wespath Benefits and Investments website.