By Evan Witkowski
Manager, Institutional Relationships
October 7, 2022
I recently came across an article in The Intelligent Investor titled “Three Ways You Can Cash In on Cash.” The article explains why the current market environment gives investors added reason to hold cash equivalents in their portfolios. When I use the term “cash equivalents”, I am referring to short-term fixed-income instruments characterized by low-risk and high-liquidity, meaning that one can readily redeem their securities for actual cash.
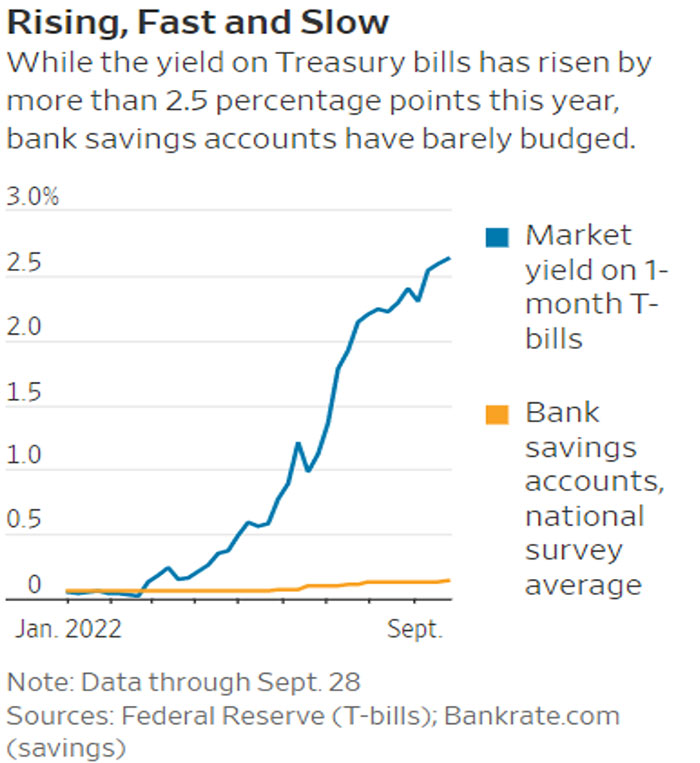
So why is now a good time for investors to hold cash equivalents? Today, we see soaring interest rates in response to persistently high inflation. In a recent blog, I explain that as of late September, the Fed Funds overnight bank lending rate target range is 3.00%–3.25%, with more anticipated rate increases to come. This sets the scene for rate increases across the board.
This said, for investors with near-term needs of liquidity from their investments, what are viable short-term cash investment options for investors?
The easiest way for an investor to benefit from the increase in yields is by moving cash into short-term U.S. Treasury Bills (T-Bills), which currently yield over 3%. In comparison, the average yield for savings and money market deposits is 0.17% and 0.18%, as reported by the Federal Deposit Insurance Corporation as of September 19, 2022. The Fed Funds target rate is expected to peak closer to 4.6% based on future expectations, which means investors should expect to earn more on T-Bills in the near-term.

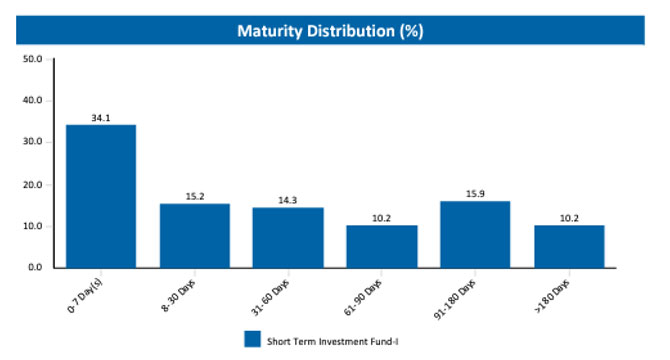
For institutional investors with near-term liquidity needs and seeking to maximize returns, Wespath Institutional Investments (WII) offers an investment fund option, the Short Term Investment Fund – I Series (STIF-I) that we believe is even better positioned in the current market environment for such investors. The objective of the fund is to preserve capital while earning current income greater than that of typical money market funds. STIF-I allocates approximately 79% to cash and cash equivalents with one-year-or-less to maturity (as of September 30, 2022).

In addition, as of September 30, 2022, STIF-I’s yield to worst (YTW)—or the “worst” possible yield earned if all of the bond issuers exercise their right to redeem their bonds before maturity, and assuming no issuer defaults—was 3.42% (gross-of-fees). Net-of-fees1, the YTW for STIF-I is approximately 3.08%, though one might reasonably expect that the rate will increase along with future Fed rate increases. Bonds are most often redeemed by the issuer before maturity when interest rates fall and the issuer can refinance with bonds offered at a lower rate. The U.S. government does not redeem T-Bills before maturity.
To make this comparison using dollar values, if an investor deposited $250,000 into the average bank money market account with an annualized 0.18% yield, the annual income derived on the investment would be just $450. In comparison, a yield of 3.08%, produces additional income of $7,250.
While STIF-I is not FDIC-insured, it allocates 79% to cash and cash equivalents, including T-Bills (the fund allocates the remaining 21% allocation to near-term asset-backed and investment grade securities).2 T-Bills are explicitly backed by the U.S. government.
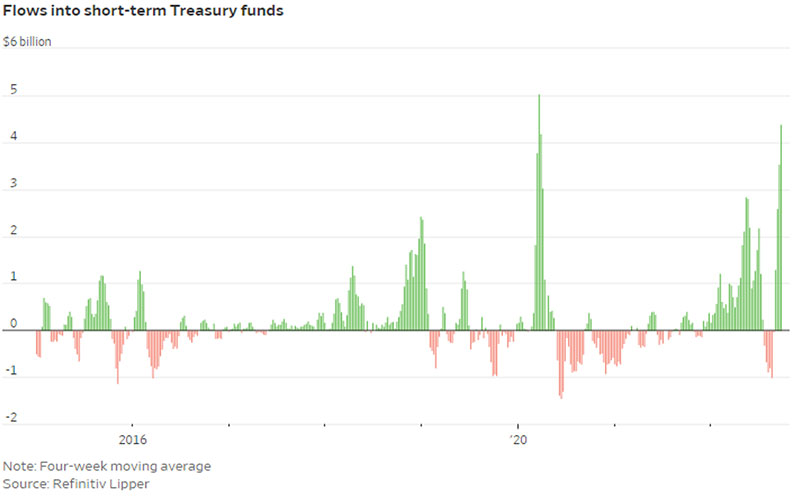
In the chart below, as of September 28, 2022, you can see the extent of investor funds movement into T-Bills, with inflows spiking as of late.

Operationally, WII can facilitate routine periodic transfers for its clients by moving cash from STIF-I into their checking accounts. This approach allows an organization to efficiently manage its cash flow needs.
In a challenging economic environment, why not structure your cash management to capture higher yields to fund your mission? If you would like to learn more, please contact our team at [email protected] with any questions you may have.
1The fee information (Annual Fund Operating Expenses) set forth above is based on actual asset balances, fees and expenses, and various other factors. This information is as of December 31, 2021. WII expects that the Annual Fund Operating Expenses for 2022 will not be materially different. There is no guarantee that STIF-I’s actual 2022 Annual Fund Operating Expenses will match the amounts reflected. Actual Annual Fund Operating Expenses may vary depending on, among other things, market events, fund size, transaction costs, timing of fund inflows and outflows, and applicable internal costs and third-party fees. In addition to the Annual Fund Operating Expenses, STIF-I may pay transaction costs, any performance fees charged to the fund including carried interest (collectively, “Performance Fees”), interest expenses and taxes from fund assets. These transaction costs, Performance Fees, interest expenses and taxes are not reflected in Annual Fund Operating Expenses, but will be paid from fund assets and will impact the calculation of fund performance. Performance Fees can vary significantly from year to year.
2Please see the Investment Funds Description – I Series for more information about STIF-I’s principal Investment risks. Historically, in periods where the Fed Funds Rate was low, the fund lost money after fees.
What themes would you like us to cover in future blog posts? Let us know at [email protected]
To receive this chart each week via our Wespath Market Update e-mail, please contact our team at [email protected].
We have updated our website with a new look and made it simple to navigate on any device.
We will continue to add more valuable information and features. Please let us know how we are doing.
P.S. For plan sponsors and plan participants, we have a new look for you too. Check out the Wespath Benefits and Investments website.
