
By Joe Halwax, CAIA, CIMA
Managing Director, Institutional Investment Services
October 3, 2022

During the “pause” of 2020-2021, global governments took actions necessary to address serious economic concerns brought on by the pandemic. The U.S. Federal Reserve (Fed)’s efforts included lowering the Fed’s overnight bank borrowing Fed Funds rate and pumping significant amounts of monetary stimulus into the economy. In addition, Congress deployed widespread fiscal measures to get the economy back on track. The hope was that once things “normalized” and life resumed, these policy measures would allow us to press “play” and move forward.
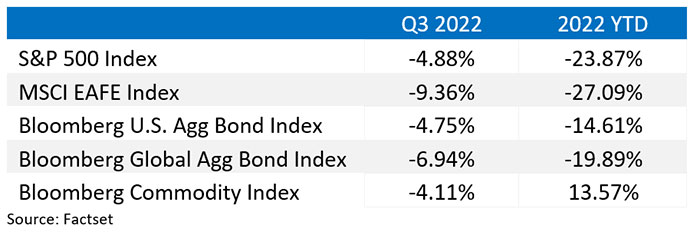
In reality, these economic measures led us to today’s persistently high inflation, rapid central bank monetary tightening, and asset market declines. Except for investments in commodities, investors have been unable to avoid the carnage across a wide variety of asset classes.
Markets started strong in the third quarter, shaking off the volatility witnessed during the first half of 2022. It appeared inflation peaked at 9.1% in June, and a growing belief the Fed might pivot to a less aggressive stance. Between July 1 and August 16, U.S. equities rallied 10%.
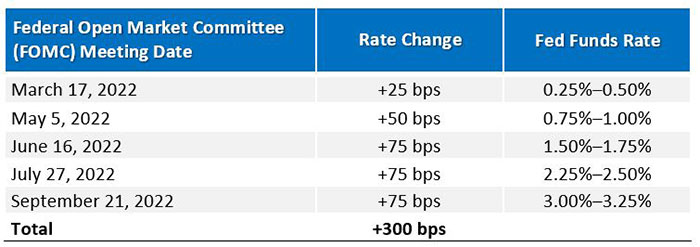
Sentiment shifted sharply following the Fed’s August 26 meeting, when Chairman Powell squashed any hopes of a Fed rate pivot. The Fed hiked rates by 75 bps for the third consecutive meeting, taking its Fed Funds rate to 3.00%‒3.25% (see Chart 1). Chairman Powell stated, “Restoring price stability will likely require maintaining a restrictive policy stance for some time. The historical record cautions strongly against prematurely loosening policy.” As a result, markets reversed course—from mid-August through quarter-end, the S&P 500 fell 16.5% and a bond sell-off ensued on the heels of the Fed’s aggressive action, which pushed yields higher.
Chart 1: Fed Funds Rate Increases 300 bps Since January
The difference in Fed rate expectations relative to a year ago is staggering. To quote my colleague Evan Witkowski’s recent blog, “In September 2021, the median [Fed] rate projection for September 2022 was 0.25%, with a median expectation of 1.0% at year’s end….The median estimate for the 2022 year-end Fed Funds Rate is now 4.4%, with the expectation that rates will peak at 4.6% in 2023. Given this unprecedented change in expectations, it is unsurprising that markets, both equities and fixed income, experienced such drastic declines.”
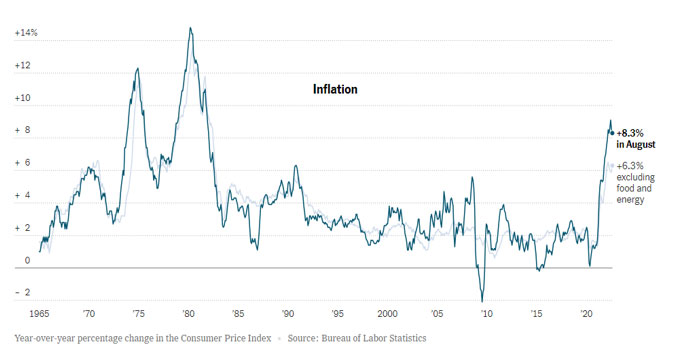
The proverbial “nail in the coffin” for any hope on near-term Fed easing, was August’s U.S. Consumer Price Index (CPI) data release on September 13. Inflation came in at 8.3% year-over-year, hotter than the 8% expected.
Chart 2: Year-Over-Year % Change in CPI
As a result, the S&P 500 lost 4%, the worst daily session since June of 2020. Bond prices also surged, with the 10-year U.S. Treasury yield moving approximately 20 basis points higher to 3.45%. As inflation fears remained the main focus, the 10-year yield broke 4% in late September and closed the quarter at 3.8%.
The 2-year U.S. Treasury yield is now at 4.3%, the highest since October 2007. It is also roughly 50 bps above the 10-year yield, which translates to an “inverted yield curve.” This inversion indicates investors expect lower long-term rates, which may indicate slower future growth.
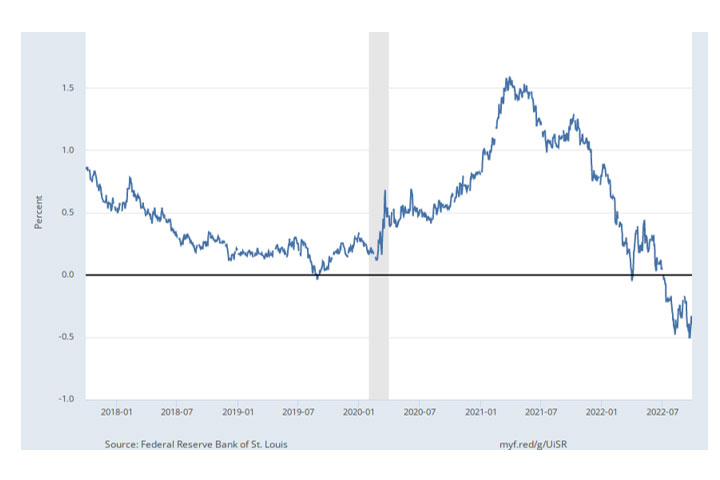
Chart 3: Market Yield on 2-Year U.S. Treasury Securities
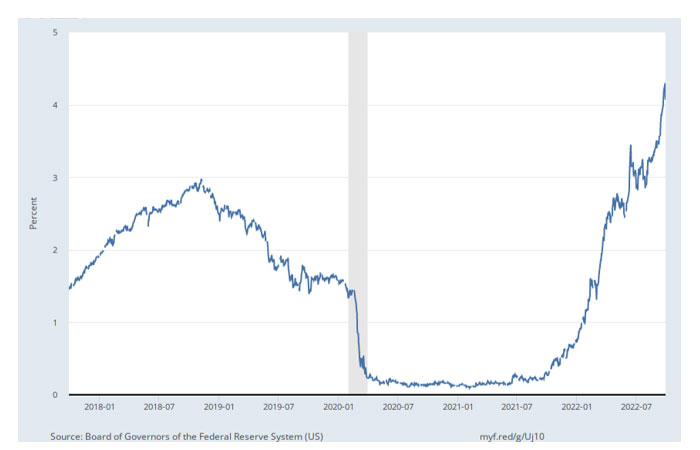
Chart 4: 10-Year Minus 2-Year U.S. Treasury Yield
In an otherwise gloomy environment, U.S. employment conditions remain strong, with unemployment remaining near 50-year lows (3.7% in August, down from 5.2% a year prior). There are 11.2 million open jobs according to the July Job Openings and Labor Turnover Survey Report, or roughly two jobs for every one unemployed person.
This said, however, a Bloomberg report in August shows 20 million U.S. households, or one in six, are delinquent in paying their utility bills. The personal savings rate, as provided by the Department of Labor’s U.S. Bureau of Economic Analysis, has fallen to its lowest level since the Great Financial Crisis.
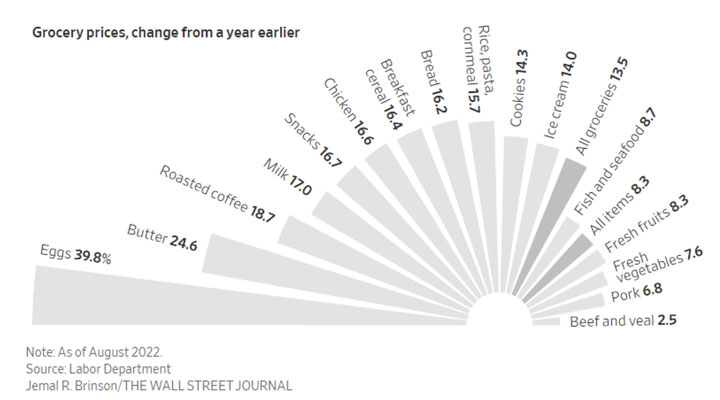
What’s more concerning are the areas where inflation is highest—housing, food and energy. When food (see Chart 5), gas and rent increase simultaneously, there is little room to substitute. This increase in the price of essentials disproportionately impacts disadvantaged communities and exacerbates the already pervasive wealth gap.
Chart 5: Grocery prices, change (%) from a year earlier
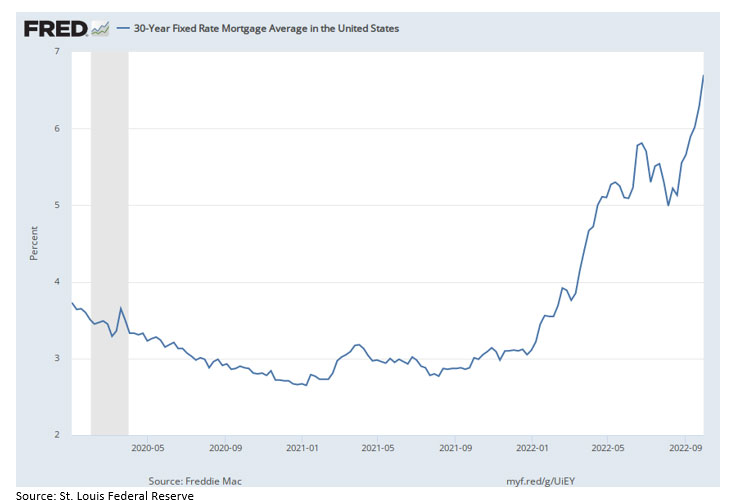
Additionally, mortgage rates have moved sharply higher with the yield curve. In August 2021, the rate for a 30-year mortgage averaged 2.87%; today it is closer to 6.7%, an increase of nearly four percentage points (Chart 6)! Combine the increase in mortgage rates with the rise in housing prices, and the monthly mortgage payment for an average home is roughly double what it was in January 2021.
Chart 6: 30-Year Fixed Rate Mortgage Average in the U.S.
Europe’s inflationary environment is considerably worse. Natural gas and electricity prices skyrocketed in August, rising 10‒15 fold before falling by about half in September. As Q3 concluded, gas prices were roughly eight times their 10-year average! The higher prices threaten many vital businesses and manufacturing centers, and governments are intervening with emergency measures.
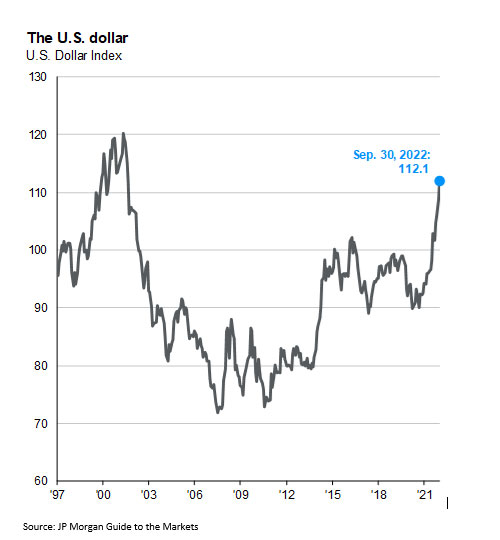
The dollar is not merely strong—it is at a 20-year high relative to its major trade partners, including record highs relative to the U.K. and Chinese currencies. The dollar’s rally is largely due to interest rate differentials as the Fed moved faster than projected to raise rates. Another factor pushing is the uncertainty and challenges in other areas of the world, such as Europe’s energy crisis, the U.K.’s new leadership and China’s real estate collapse.
A very strong dollar can be a headwind to asset prices as there is a significant impact on foreign countries’ ability to purchase U.S. food and energy. In addition, U.S. investor holdings of foreign stocks and bonds will weaken due to the negative currency impact.
Chart 7: The U.S. Dollar Reaches 20-Year Highs
In the last eight bear markets, the Fed was able to use monetary easing to bolster the economy (see Chart 8). However, these bear markets did not experience the levels of inflation we see today. This time the Fed is forced to hike rates, in order to temper inflation.
Chart 8: Fed’s Response to Bear Markets Historically
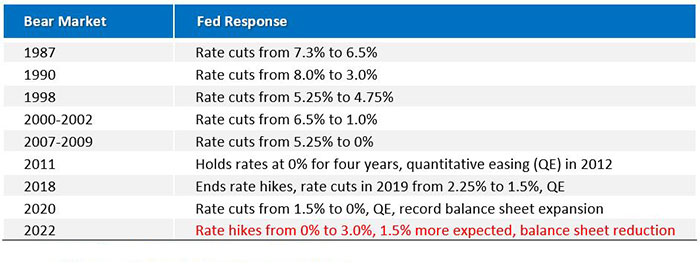
Source: https://compoundadvisors.com/2022/9-chart-sunday-9-4-22
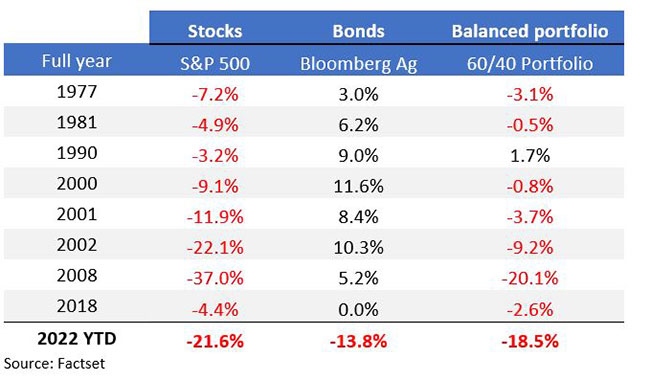
In addition, bond prices are sharply lower in today’s market, and were unable to offer the level of protection seen in the past. Chart 9 shows the performance of U.S. bonds and the 60/40 portfolio during the last eight negative performance years for the S&P 500. In seven of the eight years, bonds offered a positive return, offering diversification and ballast to the portfolio.
Chart 9: Bond and Balanced Portfolio Performance During the Last Eight Negative Performance Years for the S&P 500
To recap, third quarter investor optimism reversed following hawkish Fed commentary and continued high inflation. Equity prices fell further into bear territory and the bond market is having its worst year in history. It has been 40 years since inflation saw these levels, and it’s the first time in over 60 years we are dealing with a post-pandemic world. While bear markets are painful, they do present opportunities for long-term investors that can take advantage of the lower investment entry points and asset price valuations.
Alongside inflation and the ongoing aggressive Fed policy, we continue to monitor global events that can further impact markets, including ongoing implications of the Russia-Ukraine war, the energy crisis in Europe, increasing signs of a global recession, U.S. election uncertainty, faltering corporate earnings, and potential escalation of tensions between China and the U.S.
All said, while there is not an exact playbook for what’s to come, we know with time and patience, historically markets revert back to their normal cycles, rewarding patient investors. Market underperformance and dislocation are not uncommon, and we remain steadfast in our belief that the key to a successful investment program is to remain fully diversified and invested, focused on the long-term. Please contact our team with any questions you may have.
What themes would you like us to cover in future blog posts? Let us know at [email protected]
To receive this chart each week via our Wespath Market Update e-mail, please contact our team at [email protected].
We have updated our website with a new look and made it simple to navigate on any device.
We will continue to add more valuable information and features. Please let us know how we are doing.
P.S. For plan sponsors and plan participants, we have a new look for you too. Check out the Wespath Benefits and Investments website.